While Westinghouse defeated Edison in the initial “War of Currents” more than a century ago, DC has come back vigorously in recent years. Both the dwindling away of fossil fuel reserves and an increased awareness of the impact of emissions on global climate have led to a surge in renewable sources of energy. Clean production of energy represents only half of the equation; the increasing adoption of electricity for locomotion makes sure that the consumption side stays low in emissions as well. The combination of photovoltaics with electromobility has proven to be very attractive and scalable. Admittedly, there is still potential for optimization when it comes to storage of electricity, but the growing market share of hybrid and electric cars has made research on efficient battery technologies more attractive and thus driven innovation. With both production and utilization of electric energy going for DC, it is only natural to start thinking of DC grids for distribution as well. Put together, we see an impressive range of DC applications gaining momentum fast:
• HVDC power superhighways: Improving the efficiency of delivering electricity across long distances
• PV arrays: DC strings from residential to utility scale, reaching a system operating voltage of 1500 VDC to minimize BoS costs
• DC charging infrastructure: Fast charging station for electric vehicle operating on DC high power level
• Electric vehicles: Passenger cars, busses, vehicles for heavy goods transport and agriculture driven by electric drive trains
• DC storage systems: Sustainable use of solar energy with DC coupled storage systems on DC microgrids
From an instrumentation point of view, the shift from AC to DC calls for adaptations on the test & measurement side as well. After all, going for greener forms of energy does not mean we can become careless when it comes to losses and efficiency. Even if we disregard the cost, there are other good reasons to avoid wasting energy. With charging points anything but ubiquitous yet and charging times considerably exceeding classic hydrocarbon refills, every additional mile squeezed out of the battery helps to make the transition from combustion to e-mobility more attractive. And what was valid for previous applications still holds true: the lower the efficiency, the more heat dissipated, the worse reliability and longevity of the product or component.
Why use a power analyzer for DC measurements?
The increased need for power measurements does not automatically translate to an increased need for power analyzers. Since DC power is easy to calculate – no need to account for phase shifts, power factors etc. – why use a power analyzer in the first place, instead of going for a cheaper multimeter? There are a few good reasons:
• Usability: Measuring and multiplying voltage and current separately can be cumbersome and error-prone. Power analyzers offer superior ease of use.
• Derived values: Often, the measured DC power needs to be set in relation to AC power (DC to AC, or vice versa) to determine efficiency. At this point, a genuine power analyzer becomes necessary anyway, so why not kill two birds with one stone?
• Bandwidth: The DC signals to be measured are rarely free of AC content. Typically, there is superimposed residual ripple stemming from the switching frequencies of DC-DC converters or rectifiers. Depending on the phase relationship between voltage and current, this ripple might contribute to overall power. While the magnitude of the contribution might be minor, when looking at efficiencies >95 % it can become significant.
![]()
Figure 1: Rear Panel of the LMG671 equipped with 6 S3-channels
How AC and DC measurements differ
Having established the continued need for the use of power analyzers under this new paradigm, we need to take a closer look at the specifics. Today’s digital measurement instruments are based on the computation of voltage and current samples. The maximum signal amplitude needs to be correctly mapped to the A/D converters input range, otherwise the signal will be clipped and thus the measurement rendered invalid.
In the AC world, people typically think in RMS values, so in order to avoid clipping, the ratio of peak value to RMS value needs to be considered. This ratio is known as crest factor and can be given as ≈ 1.41 for the usual sine-shaped grid voltages. Thus, a typical European RMS grid voltage of 230 V maps to 325 V peak. However, the real peak value can be considerably higher once the signal is distorted. To spare the user mental gymnastics, it has been established to use RMS values as nominal values to label measurement ranges. Thus, when measuring 230 V grid voltage, the user simply has to select the 250 V range without wasting any thoughts on the corresponding 400 V peak value. Whereas voltage crest factors often are close to , current crest factors of up to 4 are anything but unusual. The difference between nominal and peak value of a measurement range needs to allow for those circumstances.
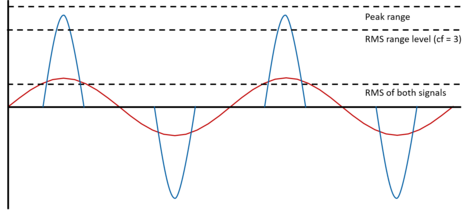
Figure 2: Comparison of two signals with same RMS value and different crest factors
Things are very different in the DC domain. RMS value and peak value are typically very close, crest factors are near 1. Even for a DC voltage up to 350 V, choosing a 400 V peak measuring range would not feel unnatural. The 50 V headroom is more than sufficient to cover any ripple voltage to be expected. Choosing the 250 V range (with naming conventions adopted from the AC world, as described above) to measure 350 V would feel decidedly odd. Intuitively going for the next range – the 400 V range with a peak value of 800 V – would lead to very suboptimal utilization and unnecessarily increase measurement uncertainty.
This example illustrates that there is no easy way to reconcile the needs of AC and DC measurements when it comes to choosing meaningful names for measurement ranges. A naming convention that leads to an optimal utilization for DC signals will risk clipping the peak values of AC signals, conversely, measuring ranges with the desired safety margin required for AC will lead to suboptimal accuracy for DC.
The only way out: offering different range types for AC and DC signals.
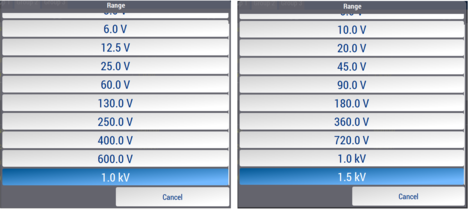
Figure 3: AC ranges selection (left) and DC ranges selection (right)
ZES ZIMMER’s S3-channel offers tailor-made measuring ranges for both AC and DC. When set to AC mode, the difference between nominal and peak values will allow for real-life crest factors. When set to DC mode, the nominal value will be closer to the maximum, suggesting a more intuitive choice of the range offering the best accuracy. In the above example, the 400 V upper limit would correspond to a 250 V range when set to AC, and a 360 V range when set to DC.
Increased Measuring Range up to 1500 VDC between terminals
It is often desirable to increase the voltage levels in power systems to reduce currents, to minimize conductor cross-sections and decrease ohmic losses. A well-known example is the expansion of PV inverter voltage limits from 1000 VDC to 1500 VDC. As a consequence, solar PV plants can become more efficient despite reduced balance-of-system costs. Similar developments are taking place in the e-mobility sector. The need for faster charging leads to higher power levels, and current is inherently limited by available space and possibilities for heat dissipation. Voltage levels are therefore expected to rise beyond 1000 VDC in the near future, especially for heavy vehicles.
With 1500 VDC becoming mainstream for key applications, the input range of the S-channel has been expanded to accommodate those requirements and the VRE adaptor has been developed. The Table 1 below depicts the measurement ranges for the jacks U* / U.
| Nominal range AC / V | 3 | 6 | 12,5 | 25 | 60 | 130 | 250 | 400 | 600 | 1000 |
| Nominal range DC / V | 5 | 10 | 20 | 45 | 90 | 180 | 360 | 720 | 1000 | 1500y |
| Max. TRMS value / V | 5,5 | 11 | 22 | 47 | 95 | 190 | 370 | 730 | 1010x | 1510x |
| Max. peak value / V | 6 | 12 | 25 | 50 | 100 | 200 | 400 | 800 | 1600 | 3200 |
| input impedance | 2,69 MΩ ± 1 % || about 4 pF | |||||||||
| Overload capability |
UAC = 1000 V + 10 % continuously UAC = 1500 V for 1 s UDC = 1500 V + 10 % continuously U = 2500 V für 20 ms, transient |
|||||||||
| Capacity against earth | about 90 pF | |||||||||
Table 1: Measuring ranges for voltage inputs U*/U
x See specifications of overload capability, max. measurable RMS values, max. Isolation voltage and the warnings at the beginning of this section.
y Measuring voltages of 1000 V < UDC ≤ 1500 V are allowed only in combination with the voltage range extenders L60-CH-S-VRE!
Accuracy Specifications
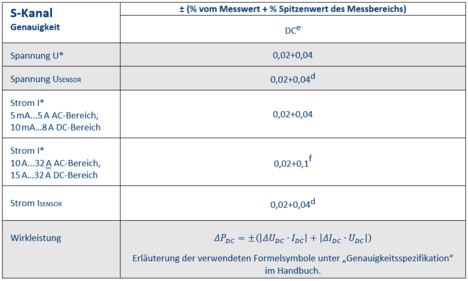
Table 2: L60-Ch-S3: DC Accuracy
f: Additional accuracy specification in the 10 A … 32 A range AC or 15 A … 32 A range DC:
d: Accuracy specification is valid with activated signal filter 15 kHz or 150 kHz
e: Accuracy specification is valid with activated automatic zero adjustment, max. 24 h after last change of the measuring range in the current measurement channel, temperature change after change of the measuring range max. ±1 ℃, max. 30 days after persistent zero adjustment in the voltage measurement channel (see ZERO ADJUSTMENT in the manual)
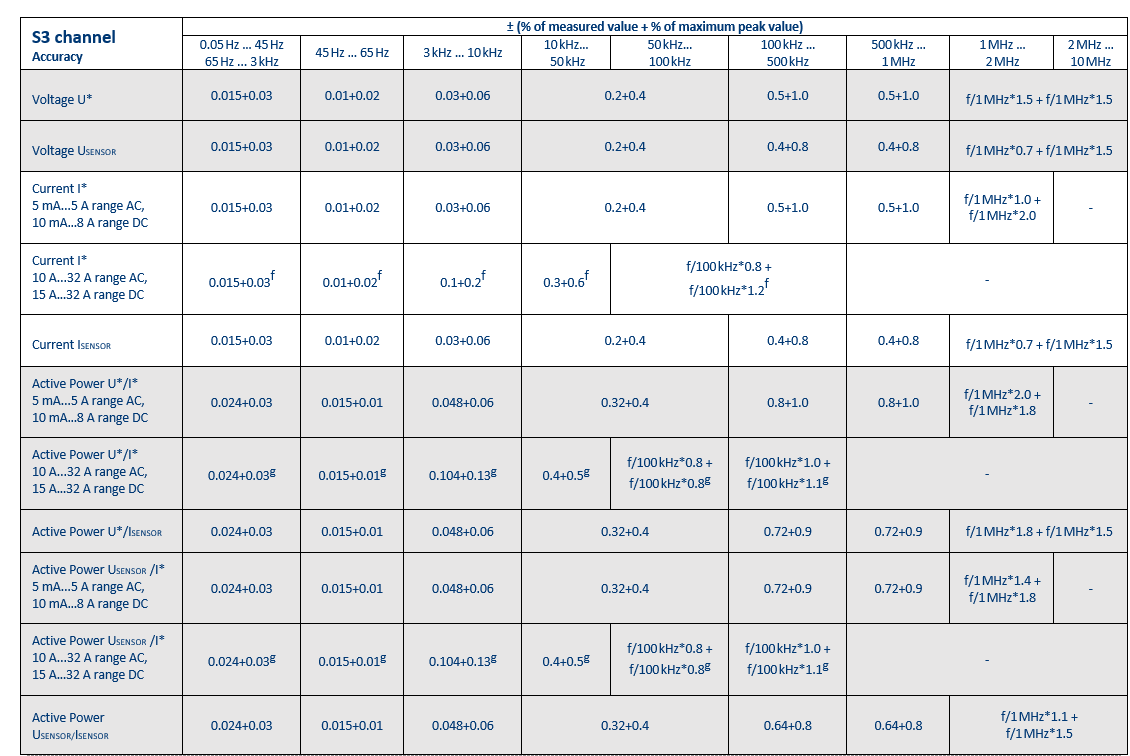
Table 3: L60-CH-S3: AC accuracy 0,05 Hz … 10 MHz
f: Additional term in the 10 A ... 32 A AC range or 15 A ... 32 A DC range: ±80 μA/A^2 ∙Itrms^2
g: Additional term in the 10 A ... 32 A AC range or 15 A ... 32 A DC range: ±80 μA/A^2 ∙Itrms^2∙Utrms