LMG Sample Vision - An advanced signal analysis for the LMG600 series
Software option L6-OPT-SPV
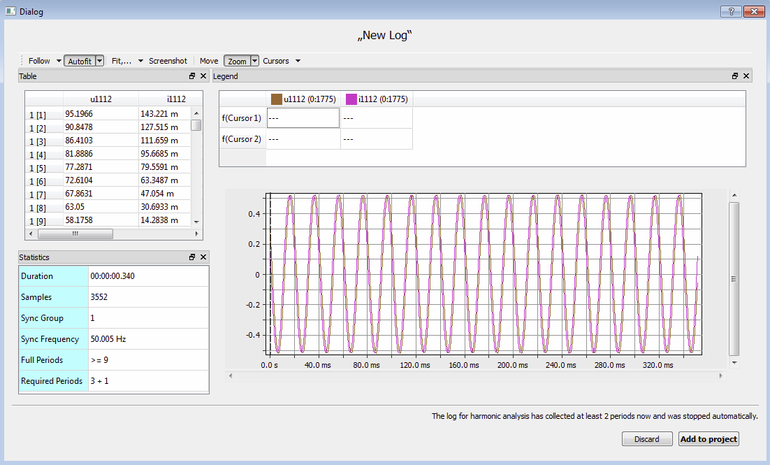
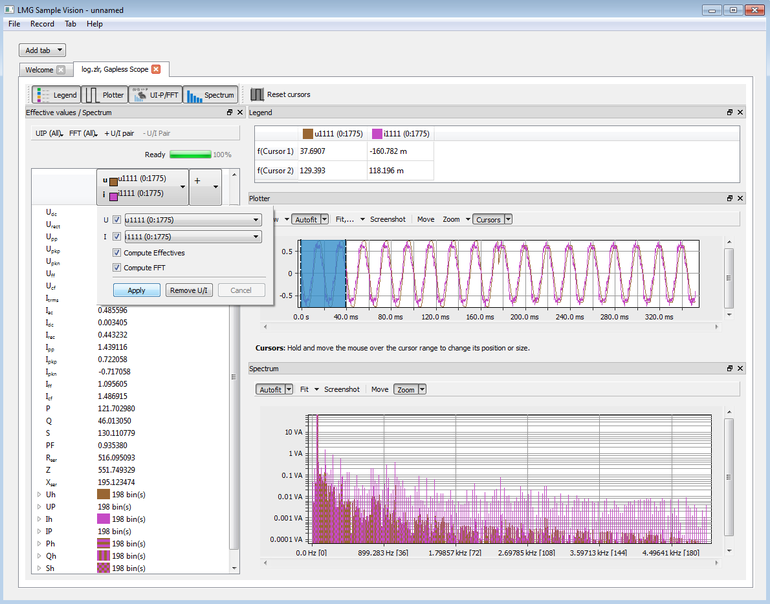
The software LMG600 Control has been extended by the tool LMG Sample Vision. Using a graphical user interface, samples of selected tracks can be transferred to the PC, stored and analyzed visually as well as numerically. In addition to the pure interface communication at command level, this represents a significant reduction in programming and data processing effort. LMG Sample Vision is optimized for simple operation and fast generation of meaningful analysis results. In addition to the usual cycle-based calculation of measured values and the transient recording of the power meter, the tool thus provides the user with an advanced and powerful analysis possibility of relevant signals directly on the PC.
In certain measurement applications, the analysis and recording of continuously calculated measured values is not sufficient to perform a complete qualitative characterization of the device under test. For instance in case of electronic devices, certain operating conditions result from control units, which must be verified according to various test specifications. Particularly such specifications as checking measured or rather rms values, which shall be integrated from specific starting times and for certain durations, push a simple power analyzers to its limits. There is a restriction by fixed measurement cycles in common power measurement. If previously mentioned measurements shall be executed not only in the time but also in the frequency domain, the user will be confronted with an additional programming effort, which is not to be underestimated. And this already before the actual measurement even started.
The Sample Vision tool significantly reduces this effort, since a wide range of analysis functions are already implemented. The subsequent saving of the project and exporting of the data into common formats also facilitates hassle-free follow-up analysis.
Characteristics:
- Transfer of sample values of up to 16 tracks at up to the maximum recording rate of 1.2 MS/s or guaranteed gapless at up to 10 kS/s
- Automatic gapless recording for a harmonic analysis, with specification of desired amount of harmonics and interharmonics
- Signal visualization of any number of previously recorded values
- Additional calculation of rms values of current, voltage and power
- Free determination of the integration window for calculating measured values
- Export the frequency spectrum and rms values to CSV or Octave format
Applications:
- Recording and evaluation of repetitive voltage or current peaks
- Calculation and comparison of harmonics in different operating conditions
- Record switching-on processes and analyze signals graphically and numerically
- Record operating behaviours of electronic circuits and determine signal characteristics


