How to read accuracy specifications without overlooking the fineprint
Modern digital power analyzers from various manufacturers are mostly based on the same fundamental principles. However, sometimes it is difficult to recognize the important differences between them, especially when it comes to calculating the measuring accuracy for the intended measurement. Figure 1 shows the most considerable factors that influence the device’s measuring accuracy. This application note will take you on a deep dive into those factors and will focus on how to interpret technical accuracy data from the specifications without overlooking the fine print.
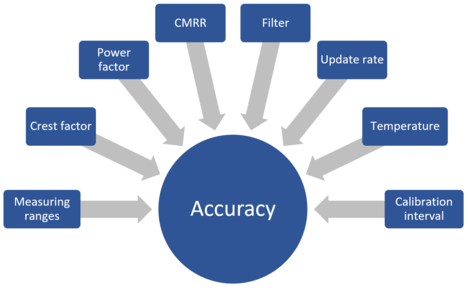
Figure 1: Factors that influence the measuring instrument’s accuracy
Measuring ranges and crest factor
It is common that the measuring ranges affect the accuracy of power analyzers. In particular, the vast majority of manufactures define the accuracy of readings as voltage, current and power based on the equation:
± (% of reading + % of range)
The second term “% of range” is specified based on two different approaches. In the first approach, a nominal TRMS range with a crest factor is specified. Alternatively, the peak measurable value specifies the range in the second approach. At this point, the debate arises:
Peak-based or RMS-based definition of measuring ranges?
What technique is better and how does it affect the overall accuracy?
Analog instruments relate to the DC or RMS component of a signal to display the true value. Due to some analog-related characteristics of the working principle (e.g., saturation, nonlinearities of components) of these instruments, it could possibly happen that signals with a peak value much higher than the RMS value could suffer from truncating. Therefore, those instruments had to be specified with a maximum allowed crest factor (ratio of a waveform’s peak amplitude to its RMS value) for which a reading within the specification could be guaranteed. However, there was no concrete limit for the maximum measurable peak value. Hence, the range used for error calculations was the RMS range for sinusoidal signals.
Nevertheless, modern digital power analyzers process sampled signals and therefore utilize analog-digital converters (ADC) in their measuring paths. The measuring range is now defined as the largest value an ADC is capable to sample. The RMS can be as large as this largest value (e.g., in the case of DC) or also significantly smaller (e.g., in the case of inrush current). Due to this reason, the only range value for a meaningful error calculation, which could be physically legitimated, is the peak value, thus the range of the ADC.
For a better understanding of above, let us consider two different signals with same RMS value: A pure sinusoidal signal with a crest factor of roughly √2 ≈ 1.414 and a highly distorted signal with a higher crest factor as illustrated in Figure 2.
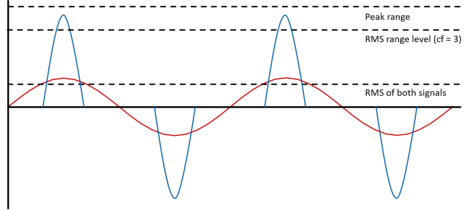
Figure 2: Comparison of two signals with same RMS value and different crest factors
In general, a power analyzer with Autorange based on RMS values will set a measuring range that accepts a peak value of 1.44 times the RMS value, where the whole waveform will be captured in the measurement – given that the signal is sinusoidal or has a crest factor less than 1.414. Conversely, in case the signal has a crest factor greater than 1.414 it will lead to “clipping” phenomena since the waveform’s peak value will exceed the measuring range’s maximum capability.
Some manufacturers that base their specification on RMS range optionally provide choosing a default crest factor of the instrument (usually 3 or 6) to reduce the chance of measuring incorrectly due to measuring range clipping. However, highly distorted signals originating from modern power electronic applications are anticipated to have peak values that exceed a predefined selected crest factor.
Overall, it is meaningless to specify an RMS measuring range regarding error calculations for modern measuring instruments with ADC sampling. Due to this, and to provide the user a trustful and meaningful specification, ZES ZIMMER states the relevant and appropriate - from a technical point of view - peak value of a measuring range, as it represents the true upper limit of the ADC.
Power factor
Another important parameter to consider when calculating the accuracy of your power measurement is the power factor (PF). You may think that its impact on the measuring accuracy is almost negligible. In fact, this can have a detrimental impact on the accuracy of your power measurement and should be taken into consideration without exception.
| Most of the manufacturers provide “superior” accuracy specifications assuming a power factor equal to one, while choosing to add PF-relevant fine print when it comes to applications with real-life power factors <1. This is a common practice and therefore the concerned user should be aware of it. Figure 3 shows the increasing power measurement error by considering the power factor influence. |
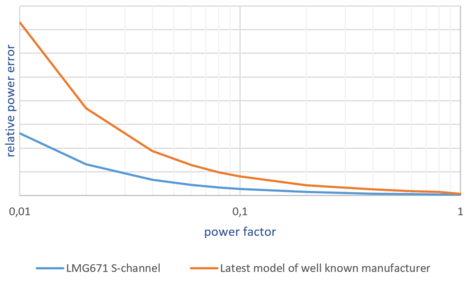
Figure 3: Power accuracy vs. power factor / 230Vrms, 2.5Arms, 50Hz
ZES ZIMMER provides the accuracy specifications for a PF range of 0 to 1 and independent of any additional asterisks at the bottom of the page, which would undeniably impact the total accuracy. Clear and straight to the point, no risk of hidden pitfalls.
ZES ZIMMER provides precise determination of the active power, even at sophisticated measuring applications with lowest power factors (PF < 0.01) and very low voltages.
Calibration intervals
Any measuring equipment has to be calibrated regularly at intervals specified by the manufacturer. This ensures valid measurement results for a given accuracy. If deviations detected during the calibration process lie outside specification, it is advisable to adjust the instrument to correct these deviations to a minimum utilization of the specified tolerances.
When deciding how long a calibration interval should be, it is of vital importance to consider the cost of frequent calibrations and of course the downtime caused by the service. Manufacturers recommend different recalibration intervals, and if adjustments are frequently required, it leads to suspicions regarding the reliability of the instrument.
| ZES ZIMMER | Manufacturer X | Manufacturer Y |
| 12 months |
6 months 12 months: 1.5-times reading accuracy |
No reference but annual calibration recommended |
Table 1: Guarantee period for specified accuracies
In order to compare apples to apples when judging specifications, particularly accuracy, the conditions should match. Hence, as with the scenario above this means considering equal accuracy guarantee periods, respectively calibration intervals, to have a valid and meaningful contrast. Table 1 points out typical conditions and differences that can be found in specifications of most modern power analyzers.
Power analyzers by ZES ZIMMER show very low utilization of only few percent of the specified tolerances after adjustment which are guaranteed within a calibration interval of 12 months. ZES ZIMMER also certifies that the reference devices used by the calibration laboratory can be traced to standards from the national metrology institute, the Physikalisch-Technische Bundesanstalt (PTB).
Common-mode rejection ratio (CMRR)
CMRR is a metric used to quantify a device’s ability to reject the signal common to both the positive and negative device inputs leading to influences on the measurement’s accuracy. An ideal power analyzer would theoretically have infinite CMRR which is practically not achievable due to material and design limitations. As a result, the unrejected portion of the common mode adds to the sensed load and affects the total accuracy. The higher the CMRR is, the lower the influence would be on the accuracy.
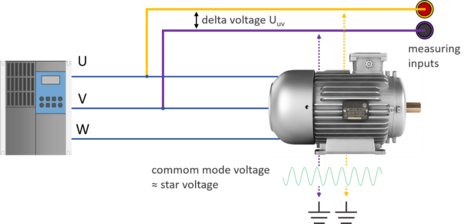
Figure 4: Common mode voltage at the inverter output
Let us consider an application like an inverter feeding a three-phase motor as shown in Figure 4. In these kind of setups, unwanted leakage currents are caused by the inverter pulsing. They mainly occur when capacitive structures at the inverter output are recharged due to pulsing. These currents are generated in the motor cables and motor insulation and in turn, they cause noise, which is consequently superimposed over the power analyzer’s measuring inputs, affecting thus the accuracy.
Suppose we have an application with a sinusoidal input signal of 100 V at 50 Hz against earth. Referring to the measuring input’s specified common-mode rejection ratio (CMRR) we want to calculate the influence of the common-mode voltage of power analyzers from different manufacturers, X and Y. Both differ in their approach and specification.
| Specification | Manufacturer X | Manufacturer Y |
| CMRR at 50Hz Condition |
120 dB 100 Vrms at 50Hz common mode voltage applied between shorted measuring inputs and PE |
50/60 Hz: ±0.01% of range or less 1000 Vrms applied to measuring input Voltage inputs shorted |
| Result |
0.1 mV abs. influence 0.0001 % rel. influence |
±0.001% * 300 V = 30 mV* abs. influence 0.03% rel. influence |
*Formula linearly scaled from 1000V to 300V applicable range due to CF=3 related RMS measuring ranges technique by manufacturer Y
Table 2: Calculated common-mode voltage influences on voltage measurement
When it comes to comparing the 0.1 mV absolute common-mode voltage influence of manufacturer X with the 30 mV of manufacturer Y, it is concluded that manufacturer X is 300 times more accurate. Table 3 shows the CMRR of ZES ZIMMER’s power analyzer LMG671 measuring inputs. Details can be taken from manual.
|
Common-mode frequency |
Signal- filter |
Voltage input (+) 3 V range |
Voltage input (+) 1000 V range |
Current input (+) 5 mA range |
Current input (+) 32 A range |
| 53 Hz | 15 kHz | > 120 dB | > 120 dB | > 160 dB | > 150 dB |
| 53 Hz | off | > 120 dB | > 120 dB | > 160 dB | > 150 dB |
| 100 kHz | 15 kHz | > 120 dB | > 120 dB | > 160 dB | > 150 dB |
| 100 kHz | off | > 75 dB | > 75 dB | > 100 dB | > 150 dB |
Table 3: CMRR specification of ZES ZIMMER’s LMG671 measuring inputs
Filters
Another factor to bear in mind when it comes to accuracy specifications is the filter settings. In particular, some manufacturers in their attempt to minimize noise and aliasing (esp. harmonic measurement) use anti-aliasing filter (AAF) respectively line filters. The accuracy given by some manufacturers depends heavily on the choice of the cut-off frequency of these filters, but are either not obviously pointed out nor even meaningful specified.
Some manufacturers specify the influence of a filter on the measured value with a ± tolerance, with low-pass filters attenuating a signal amplitude rather than amplifying it. The specification is questionable or may be based on a less good filter property. Depending on the characteristics and filter order, the attenuation is stronger or weaker depending on the corner frequency.
Correct or better would be to explicitly specify the filter attenuation as a systematic error and furthermore to specify the uncertainty of the attenuation. Since this will allow the user to explicitly calculate the filter error, ZES ZIMMER power analyzers of the LMG series provide detailed error specification of the set filter which furthermore have comparably low influence as shown in Table 4.
| Specification |
ZES ZIMMER LMG671 A-channel |
Manufacturer X |
| Filter |
Signal low pass antialiasing filter Bessel 7th order, 145kHz |
Line low pass filter Bessel 5th order, 1Mhz |
|
Filter influence at 1kW Ufund = 500Hz sinusoidal |
U/I: - (0.0004% ± 50 · 10-6) of reading - 0.107997 W |
U/I: ± (20 × f/1Mhz) % of reading ± 0.2 W |
Table 3: CMRR specification of ZES ZIMMER’s LMG671 measuring inputs
Power analyzers from ZES ZIMMER facilitate simultaneous analysis of narrow and wide bandwidth values using their unique DualPath Technology, without risking aliasing effects. At the same time, filter influences on the accuracy will be kept very low compared to other manufactures. Explicit specification of the filter attenuations allows frequency targeted elimination of the influence on the signal measured to ensure highest accuracy.
Temperature
Temperature obviously has an impact on measuring accuracy, and environmental conditions in real life are not always as easily controlled as in a laboratory setup. Hot climates and insufficient ventilation can cause considerable problems. In order to quantify the influence of temperature on accuracy, manufacturers typically provide a temperature coefficient to be used in a formula relying on a linear dependency. This dependency is only valid within a limited temperature range, though, outside of which the impact can dramatically change for the worse. Therefore, the larger this linear temperature range, the easier it will be to carry our reliable and stable measurements under realistic conditions.
ZES ZIMMER guarantees its accuracy specifications for an ambient temperature of (23±3) ℃ where no additional heating or cooling effects (e.g., by sunlight or current of air) occur. The temperature effect is at:
± (0.01 % of reading)/ K in the range of 5 ℃ … 20 ℃ and 26 ℃ … 40 ℃
Figure 5 illustrates the deviation from standard accuracy for a temperature range of 5 ℃ to 40 ℃.
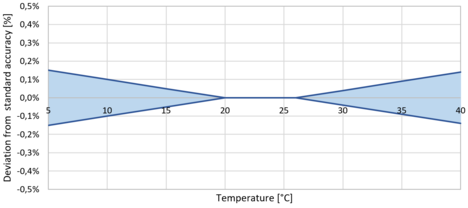
Figure 5: Deviation from standard accuracy vs environmental temperature for the LMG600 series
Cycle time (or data update rate)
Some manufacturers add an additional error to the accuracy for different cycle times (the term data update rate can also be used), which is basically the measuring interval cycle as illustrated in Figure 6, respectively the integration interval of the readings.
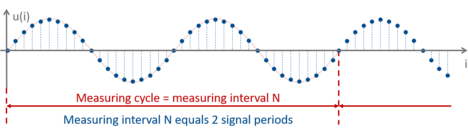
Figure 6: Cycle time respectively the measuring interval
Usually, they add an additional error to the accuracy in the form of “% of reading” and this has to be taken into consideration. On the other hand, other manufacturers provide the user with the benefit to freely apply any desired cycle time, without additionally affecting the specified accuracy at all.
The LMG600 series high precision power analyzers from ZES ZIMMER facilitate a measuring cycle of 10 ms up to 60 s, ensuring gapless measurement without the least impact on the measuring accuracy.
[Authors: M.Sc. Andreas Alexandrou, M.Sc. Patrick Fuchs]